
The total breakdown of the votes cast for Redditch in the Worcestershire County Council elections:
Arrow Valley East: (was UKIP majority – 281 and Labour majority – 32)
Joe Baker (Lab) – 1,913
Tom Baker-Price (Con) -1,957
Peter Bridle (Ukip) – 849
Juliet Brunner (Con) – 2,000
David Gee (Lib Dem) – 316
Wanda King (Lab) – 1,637
Paul Swansborough (Ukip) – 965
Robert Wardell (Greens) – 167
Rylma White (Greens) – 155
Hans Windheuser (Lib Dem) – 209
(10 ballots rejected)
Arrow Valley West: (was Labour majorities – 357 and 209)
Matt Dormer (Con) – 1,574
Andrew Fry (Lab) – 1,943
Kathy Haslam (Ukip) – 466
Pattie Hill (Lab) – 1,797
Scott Preston (Ukip) – 468
Russell Taylor (Lib Dem) – 220
David Thain (Con) – 1,276
Diane Thomas (Lib Dem) – 290
Rachel Wardell (Greens) – 176
Kevin White (Greens) – 126
Sharnah Wynn – 121
(10 ballots rejected)
Redditch North: (was Labour majorities – 379 and 376)
Brandon Clayton (Con) – 1,921
Robin Lunn (Lab) – 1,994
Tony Pitt (Lib Dem) – 257
Steve Pound (Greens) – 264
Gareth Prosser (Con) – 1,698
Barry Thornton (Ukip) – 377
Simon Venables (Greens) – 238
Graham Vickery (Lab) – 1,841
Ian Webster (Lib Dem) – 189
Sally Woodhall (Ukip) – 388
(six ballots rejected)
Redditch South: (was Conservative majority – 69 and UKIP majority – 58)
Roger Bennett (Con) – 2,998
Gilly Cooper (Lab) – 1,467
Claire Davies (Greens) – 312
Pamela Gee (Lib Dem) – 357
David Greenwood (Ukip) – 338
Melvyn Haigh (Ukip) – 463
Rita Hindle (Lib Dem) – 341
Mike Lewington (Lab) -1,313
Jane Potter (Con) – 2,599
Aistair Waugh (Green) – 237
(eight ballots rejected)
In Redditch the Tories gained four new seats and held on to one – leaving five out of the eight available seats now occupied by them – both Labour and UKIP each lost two.
The overall turnout of voters in Redditch was up from the 2013 election which saw 28.99 per cent of people vote, while this year 32.16 per cent registered their support.
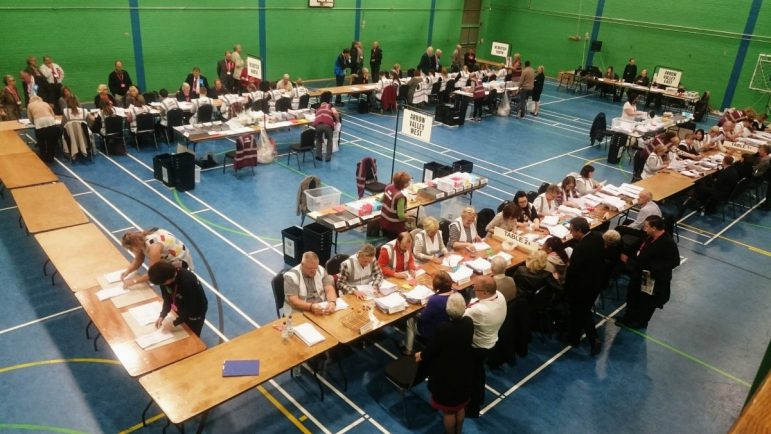
Polling stations closed at 10pm on May 4, and verification and counts took place across the county on Friday (May 5) from 10am with an overall turnout of 34.8 per cent.
The County Council Results by party:
Conservative – 40
Labour – 10
Liberal Democrat – 3
Green – 2
Independent – 1
Independent Community and Health Concern – 1
For more information, visit www.worcestershire.gov.uk/elections